Anatomy of an Investigation: How We Took Apart the World’s Largest AI Directory
Executive Summary
There’s an AI for That — TAAFT — looks like the closest thing the AI-tools world has to an editorial authority. “AI use cases, updated daily,” reviewed by staff for quality and fit. If you run a tool, getting listed feels like being chosen. If you’re a marketer deciding where to launch, it reads like a tastemaker worth courting.
I went into this investigation expecting to confirm a fairly ordinary story: a paid-submission directory dressed up in editorial language. That’s not quite what I found. The reality is more interesting, and for anyone buying placements or evaluating the asset, more consequential. Four separate lines of evidence — the platform’s own pages, its archived pricing history, its infrastructure, and a dataset of its entire listing catalog — all point the same direction.
- The catalog is machine-generated, and TAAFT says so itself. Tool pages sit on the site attributed to an “unverified author,” with a button inviting the real owner to “claim” them. Nobody from those companies wrote or paid for those pages. The platform generated them — at scale, to rank in search and pull traffic.
- The money doesn’t come from listing; it comes from claiming. A page is created for free. The owner is then sold the right to verify it, control it, and amplify it — $49 for a basic listing, $347 for the “maximum exposure” package that buys a newsletter slot and priority placement. Prominence is a line item.
- Content production broke from its own history in early 2026. I pulled publication dates for 8,390 listings. For more than three years the site added roughly 150 tools a month, like clockwork. Then, in early 2026, it jumped — 663 in March alone, about 4.5 times the long-run baseline, and it held there for months. Directories don’t quadruple their curation rate overnight. Software does.
- And the listing business is bigger than it looks. Working only from TAAFT’s own published prices across time and the size of its catalog, I model cumulative listing revenue at roughly $1.4M–$2.0M, with a floor near $1.44M that holds even if not a single tool ever bought the upsell. The revenue curve tracks the automation event almost exactly: the moment the content engine scaled is the moment the money did.
- Put together, the picture is hard to miss. TAAFT’s authority is, in large part, manufactured and then sold. Its rankings reflect what was paid for and what an algorithm produced, not what an editor judged. That doesn’t make it worthless as a traffic source — it makes it an ad network wearing an editor’s jacket. And it means there is very likely a page about your product on TAAFT right now that you never authorized, possibly describing it wrong, with a “claim this” button waiting.
1. What I Did, and What I Didn’t
I’d rather a reader know the edges of this investigation than guess at them. Everything below is sourced to primary evidence — archived captures, the platform’s own crawlable data, infrastructure records. Where I’m inferring rather than stating, I say so. Where I didn’t look, I say that too.
What I covered:
- Reconstructed the monetization model from archived submission and pricing pages (2023–2026) and the live claim flow.
- Modeled the listing business from documented pricing and catalog size.
- Analyzed publication velocity across 8,390 dated listings (October 2022 – May 2026).
- Compared two cohorts of listings — 2022 founder-era against 2026 programmatic-era — line by line.
- Fingerprinted the technology stack and traced hosting history back to 2017.
What I deliberately left alone, and why:
- Who runs it. I tried. It’s behind registrar privacy (§2). I name no one and make no ownership claim — the evidence doesn’t support one, and guessing would be irresponsible.
- Author-photo forensics. Didn’t need it. The platform’s own “unverified author” label answers the authorship question more cleanly than reverse-image work would.
- A full outbound-affiliate audit. Skipped. The money here is direct paid placement (§3), so chasing affiliate links would have been effort spent on the wrong model.
- Verified traffic numbers. Constrained — TAAFT blocks the major SEO crawlers (§7). I treat its audience claims as claims, not facts.
Confidence is labeled per finding: high (in the primary evidence), moderate (strong signal, some inference), speculative (plausible, not nailed down). I’d rather under-claim than have one soft sentence taint the rest.
2. The Domain: A Late-2022 Business on an Older Address
Confidence: High on the registration facts; the 2018 wrinkle is genuinely open
WHOIS puts the domain’s current registration at 2 October 2022, through Cloudflare’s registrar, paid out to 2033, last updated 24 October 2023. Every contact field is redacted behind the privacy proxy — no name, and no location I’d trust (the region the proxy returns is a placeholder, not evidence of where anyone sits).
That October 2022 date lines up almost too neatly with the data. The earliest dated listing in the catalog is 19 October 2022 — seventeen days after the domain was registered. So the directory as it exists today began in late 2022, full stop. The wrinkle is that the Wayback Machine has captures of this domain going back to 2018. The likeliest read is mundane: the domain existed under unrelated prior ownership, and whoever built TAAFT picked it up in October 2022. An AI directory built on a second-hand address, not a fresh one. I can’t prove the acquisition without pre-2022 WHOIS, which the privacy setup hides, so I’m leaving it as the probable explanation rather than a finding.
For an acquirer, two things sit on the diligence list: a genuinely short operating history, and an unexplained gap between the 2018 captures and the 2022 registration. Neither is alarming. Both are worth closing before money moves.
3. Free Page, Paid Claim: How the Money Actually Works
Confidence: High
This is the heart of it. TAAFT makes pages for free and sells their owners the right to control and promote them. I can show the whole mechanism from the platform’s own screens.
The free catalog. Plenty of tool pages carry the line “by unverified author” and a “Claim this AI” prompt. That’s TAAFT telling you, in its own interface, that it built the page — not the company it describes. This is the inventory layer: large, free, and there to rank.
The free claim funnel. Claiming is free — “verify … for free to gain edit rights and boost credibility.” But it’s baited: embed their badge and you get $200 in PPC credits, drop a social link and you get $50. They’re paying founders in ad credit to verify, because a verified page looks credible and because it pulls the founder into the advertising side, which is where the real money lives.
The paid tiers. Money changes hands at two price points, both labeled a “one-time review fee”: $49 for “Website only” (permanent listing, basic analytics, a $100 PPC bonus) and $347 for “Everything you need,” which adds a guaranteed spot in the newsletter, priority review, enhanced analytics, and a $300 PPC bonus. The word “review” is doing a lot of work here — it’s a paywall wearing an editor’s vocabulary.
The price history tells its own story, and I have it dated:
- Free submissions through roughly Q3–Q4 2023.
- By the 29 March 2024 capture: a $299 “Website only” tier and the $347 “Everything you need” package, the latter quoting “2M+ monthly active users, 400k+ subscribers, newsletter feature worth $3k.”
- By the 16 July 2025 capture: the entry tier had dropped to $99, the $347 package held, the subscriber claim had climbed to 1.7M+, and — quietly — the newsletter’s stated value had fallen from $3,000 to $1,000.
- By 2026: entry cut again to $49, exposure still $347, subscribers now claimed at 2.5M+.
That newsletter-value detail is small but telling. The platform’s own appraisal of a newsletter slot fell from $3k to $1k while the audience it claimed for that same newsletter more than quadrupled. A real valuation moves with the audience, not against it. The number isn’t a measurement — it’s a sales anchor, adjusted for whatever converts. Once you see that, every other figure on the page deserves the same skepticism. (Moderate confidence on the interpretation; high on the figures themselves.)
4. What the Placement Business Is Worth
Confidence: Moderate — a transparent model from documented prices and catalog size, not audited financials
Section 3 establishes that a placement is a sale. The obvious next question — the one a buyer actually cares about — is how much money that adds up to. There are no public financials for a private company behind a privacy proxy, so what follows is a model, built from two things I can document: the prices TAAFT charged at each point in time, and the number of listings in its catalog. Every assumption is on the table so you can re-run it or argue with it.
The inputs. The live catalog is about 13,688 tool pages. Of those, 8,390 expose a date, which is what the velocity work in §5 uses; the revenue model uses the full catalog. I price each listing at the entry fee documented for the period it was published — free before ~October 2023, $99 late 2023, $299 across all of 2024, $99 across 2025, $49 in 2026 — each tied to a dated capture. Undated listings are spread across those periods in the same proportions as the dated ones.
What “paid” means here. Because the catalog includes free, unclaimed “unverified author” pages, I do not assume every page was bought. The model estimates the share of pages that convert to a paid tier. The percentages below are conversion-to-paid, not an upsell layered on a fee everyone already paid.
The floor. Charge every paid-era page only its entry price — no $347 upgrades at all, free-era pages at zero — and the catalog still represents about $1.44M in cumulative listing revenue. That’s the floor, and it’s a hard one: it assumes the cheapest possible transaction for every page.
The band. Layer in a share of pages taking the $347 exposure package:
| Share converting to the $347 tier | Modeled cumulative listing revenue |
|---|---|
| 0% (floor — entry fees only) | ~$1.44M |
| 10% | ~$1.67M |
| 25% | ~$2.01M |
| 50% | ~$2.58M |
So the listing business has likely generated somewhere in the region of $1.4M–$2.0M over its life, with a floor near $1.44M from entry fees alone. That excludes newsletter sponsorships sold separately, the merchandise layer (§6), and any direct sponsorship inventory — all of which only add to it. This is listings only.
Why this isn’t the eye-catching number. If you multiply the full catalog by the $347 headline price you get about $4.75M, and you’ll see numbers like that thrown around. It’s wrong. It ignores the free founding era, ignores that the entry tier was $49–$299 for the platform’s whole life, ignores the free unclaimed pages nobody paid for, and pretends every tool bought the top package. I mention it only to set it aside. The honest figure is roughly half to a third of it.
The content explosion was a revenue event
Here’s the part I didn’t expect until I plotted it. When you put modeled entry-tier revenue next to listing volume, the two move as one — and the early-2026 jump isn’t just more content, it’s the single sharpest acceleration in the platform’s monetization. The machine that started producing 650 listings a month was also, by the same act, producing the most revenue per month in the platform’s history.
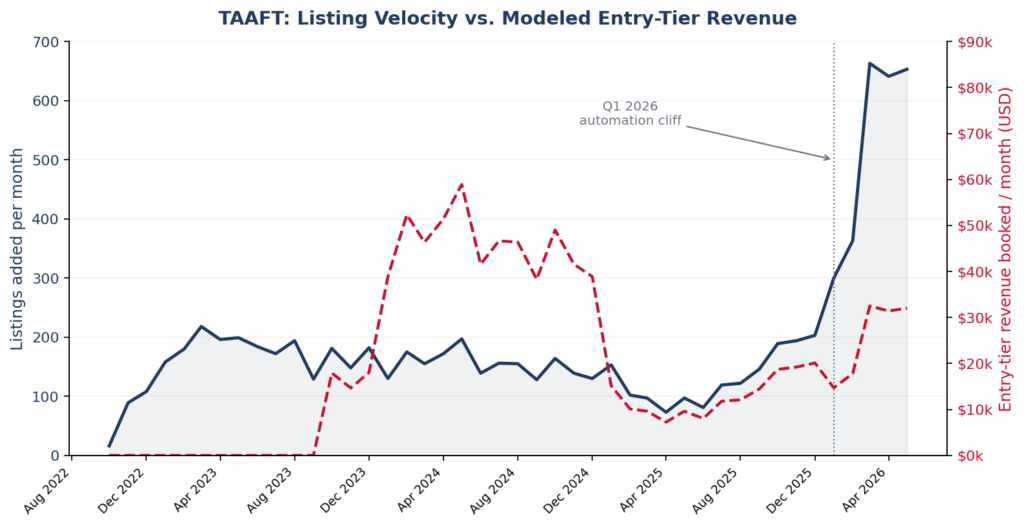
Listing velocity (navy, left) against modeled entry-tier revenue booked per month (red, right). The free era before ~Oct 2023 sits at $0; the 2024 spike reflects the $299 entry price; the model is insensitive to the exact free-era end date within roughly $100K.
For an acquirer, this is the rough order of magnitude of the asset’s cumulative top line from its core product — a useful sanity check against whatever a seller represents. If a seller claims multiples of this from listings alone, they’re either counting channels I can’t see or rounding up. For a marketer, it explains the incentive: the business runs on placement volume, and the automation in §5 is exactly the machine for producing it.
5. The Velocity Cliff, and What the Content Confirms
Confidence: High on the data; moderate on the causal read
I extracted publication dates for 8,390 listings straight from the platform’s own per-listing date field, then aggregated by month. The shape told the story before I’d written a word of interpretation.
The baseline. From late 2022 through mid-2025, publication runs flat — averaging about 150 listings a month, bouncing between 73 and 218. That’s a directory adding tools at a roughly constant, human-paced rate. There’s even a slump in early 2025, bottoming at 73 listings in April. Nothing here suggests a machine.
Then it isn’t flat anymore:
| Month | Listings added | |
|---|---|---|
| Oct–Dec 2025 | 189 – 203 | steady |
| Jan 2026 | 300 | climbing |
| Feb 2026 | 363 | |
| Mar 2026 | 663 | ~4.5x baseline |
| Apr 2026 | 641 | |
| May 2026 | 653 | sustained |
March 2026 is about four and a half times the long-run baseline, and — this is the part that rules out a one-off data import — it stays there for months. A directory does not quietly quadruple its sustained curation rate. A step-change with this shape and this persistence is what it looks like when a production process flips from human to programmatic.
Reading the pages side by side
Numbers suggest; content confirms. I pulled five listings from late 2022 and five from early 2026 and read them against each other.
The 2022 cohort — Flexberry AI Assistant, Predis.ai, AI Lyrics Generator, Erase.bg, Hyperwrite — reads like it was written or scraped by people. The lengths are all over the place. The copy is specific in the way only human-handled copy is: it names actual UI features, real integrations, concrete use cases (Erase.bg removing backgrounds “from logos and signatures,” AI Lyrics Generator’s mood range running “Very Sad to Very Happy”). It even has human residue — tense slips, and a Flexberry entry frozen mid-2022 still saying the tool is “expected to be released in 2022.” Clunky and dated, but unmistakably specific.
The 2026 cohort — Symplicured, GetIntel, AdMake AI, EduSolver, FliesReplies — reads like a template. Uniform blocks, uniform length. Nearly every one opens on the same skeleton: “[Product] is an AI-powered [category] tool designed to provide [benefit].” The vocabulary is the usual LLM wallpaper — “advanced AI algorithms,” “focus-driven design.” Features get abstracted into benefit-speak instead of described.
And then there’s Symplicured. This is the one that removes any doubt. Symplicured’s main blurb correctly calls it an AI healthcare tool that analyzes symptoms and medical reports. But its auto-generated Q&A section loses the plot entirely, recasting it as something in “the realm of product discovery … what separates it is its undisclosed capabilities, creating a veil of mystery.” That’s a generation pipeline hitting missing data and falling back on a generic template — describing a medical diagnostic tool as a mystery product. No human reviewing for “quality and fit” writes that, and none would let it through.
The platform’s own admission. I don’t even have to argue the automation point. TAAFT marks the pages it generated as “by unverified author” and asks the owner to claim them. The auto-built catalog isn’t my inference — it’s labeled, in the interface, by the platform.
One useful exception. FliesReplies, a 2026 listing, breaks the mold with a clean, manually structured “KEY FEATURES” block — which tells me founders who submit tight formatting can override the automated layout. So the architecture is an automated content layer wrapping every page, with room for manual input to punch through. That’s consistent with everything else.
Lay the pieces next to each other and they’re one finding, not four. The free “unverified author” pages and the paid-claim model explain why you’d want to mass-produce listings. The velocity cliff is the moment the production scaled. The content forensics show how — programmatic generation — and where it fails. And the revenue model shows what the whole machine pays out. Each stands on its own evidence; together they’re airtight.
6. Under the Hood: This Is Software, Not a Blog
Confidence: High on the components; the read is mine
The technology confirms what the content implies — TAAFT is a cloud-native application, not a templated content site. That’s exactly what you’d build to generate and serve listings programmatically at scale.
What’s verifiably in the stack:
- Edge: Cloudflare (enterprise proxy/WAF), confirmed by an IP history that migrates onto Cloudflare ranges from 2024.
- Application: Render PaaS (AS397273), with staging environments visible (216.24.57.251) — a CI/CD setup shipping from connected repositories.
- Origin: LiteSpeed. Media: BunnyCDN on the media/video subdomains, regional edges.
- Commerce: a Fourthwall gateway on shop.theresanaiforthat.com — a merchandise layer.
- Analytics: Microsoft Clarity session recording (token g6ywd3275i, with a commented-out legacy block still inline) and a Google Tag Manager container.
- Email: Google Workspace on the primary MX; SPF blends Mailjet for bulk with Google.
The subdomains say the most. Sixteen of them, mapping a business well past a tool list: pay., sponsor./sponsors./sponsorships., shop., newsletter., careers., empires., version-reviews., chat., gen-videos., video./media. Payments, sponsorships, a newsletter operation, video generation — these are built as first-class systems, not bolt-ons. The hosting history rounds it out: GoDaddy shared hosting in 2017–18, re-platformed onto serious cloud infrastructure by 2024. A small project that grew into real software.
What I won’t claim from this. Infrastructure tells you how something is built, not who built it. The routine artifacts — several Google Search Console verification tokens, an iCloud Custom Email Domain entry in the SPF record — are normal for any scaled operation and say nothing about ownership, so I draw nothing from them. One third-party scanner surfaced an unrelated cosmetics company sharing Cloudflare edge space; that’s a known quirk of shared-CDN reverse lookups, not a connection, and I’ve set it aside. I almost wrote it up before I caught what it was — worth saying, because that’s precisely the kind of artifact that turns a sloppy investigation into a defamation problem.
7. The Numbers You’re Asked to Take on Faith
Confidence: High
TAAFT’s robots.txt blocks the major SEO crawlers, and there’s no public sitemap. The practical result: third-party traffic and keyword estimates are constrained, and the audience figures the platform sells against — the 2M+/2.5M+ “active users,” the 400k→1.7M→2.5M newsletter subscribers — can’t be independently checked from outside. I treat them as marketing claims, not measurements.
That’s a finding in itself. A platform that sells placements on the strength of its audience, while making that audience hard to verify, is asking buyers to trust the rate card. If you’re weighing a $347 placement, or weighing the whole asset, those numbers need validating against real analytics before you lean on them. Given what the newsletter-value figure did (§3), I’d want to see the data, not the deck.
8. What This Means If You’re the Buyer
If you run an AI-tools content site: don’t try to out-curate TAAFT. You can’t out-publish a machine doing 650 listings a month. The opening is the quality gap in §5 — their programmatic pages are generic and sometimes broken. Genuinely specific, current, human reviews are the thing template output can’t match. Compete on what the automation can’t fake.
If you’re a SaaS or AI-tool marketer: assume there’s already a TAAFT page about you that you didn’t create and may not like. Claiming it is free, but it walks you into their PPC funnel; the featured slot is a $347 paid channel, nothing more. Judge it on measured CPC and downstream conversion, not on the feeling of being “listed.” And treat every audience number as unverified until your own referral data says otherwise. The “newsletter worth $3k” — now $1k — is a sales anchor, not an appraisal.
If you’re buying the asset: this is the template for diligence on any “curated directory.” The revenue is advertising and lead-gen revenue, with ad-network durability, not editorial-brand equity — and it’s on the order of $1.4M–$2.0M cumulative from listings (§4). Three risks to price in: dependence on automated content and its accuracy failures (a healthcare tool described as a “mystery product” is a real liability, not a cosmetic one); audience figures gated behind crawler blocks that need direct-access verification; and the open question of whether this traffic survives Google’s ongoing treatment of mass-generated content.
9. What I Couldn’t Pin Down
Stated plainly, because a report that hides its gaps shouldn’t be trusted on its findings either:
- Who runs it — chased, blocked by registrar privacy. Reachable with pre-2022 WHOIS, registry cross-referencing, and founder-footprint work, as a scoped add-on.
- The pre-2022 domain history — the 2018-captures-versus-2022-registration gap is still open; the archived pre-2022 content and historical WHOIS would close it.
- Real traffic — constrained by the crawler blocks; resolvable with paid traffic tools cross-referenced, and definitively with analytics access in a diligence setting.
- The true paid-conversion rate — the single biggest lever on a precise valuation, and the one assumption my model can only band rather than observe. Sampling claimed versus unclaimed pages at scale would tighten it.
- Newsletter and sponsorship revenue — not modeled here; additive to the listing figure and boundable from the platform’s own rate card.
- Google exposure — whether the 2026 content explosion collides with Google’s stance on mass-generated content is the highest-value next question for any buyer, and a clean scope for a dedicated risk assessment.
Appendix: Evidence Index
- Wayback homepage capture — “AI use cases. Updated daily.” (Dec 2022); early state “2,331 AIs for 556 tasks … used by over 500,000 people.”
- WHOIS — registered 2 Oct 2022, Cloudflare registrar, expires 2033, updated 24 Oct 2023, contacts redacted.
- Live claim flow — “by unverified author / Claim this AI”; free verification with PPC-credit incentives ($200 embed, $50 social link).
- Pricing capture, /get-featured, 29 Mar 2024 — $299 “Website only” and $347 “Everything you need”; “2M+ active users, 400k+ subscribers, newsletter feature worth $3k.”
- Pricing capture, /submit, 16 Jul 2025 — $99 “Website only” and $347 exposure; 1.7M+ subscribers; CPC $0.005–$0.2; “newsletter feature worth $1,000 included.”
- Current pricing — $49 “Website only” and $347 “Everything you need,” both “one-time review fee”; 2.5M+ subscribers; $300/$100 PPC bonuses; “never expires.”
- Velocity dataset — 8,390 dated listings, Oct 2022–May 2026 (per-listing date extraction); full catalog ~13,688 /ai/ URLs.
- Revenue model — era-bucketed entry pricing (free / $99 / $299 / $99 / $49) on the full catalog; conversion band 0–50% to the $347 tier; floor ~$1.44M, range ~$1.4M–$2.0M.
- Two-cohort content comparison — 2022 vs. 2026 named listings; Symplicured Q&A generation failure.
- Technology fingerprint — Cloudflare, Render (AS397273), LiteSpeed, BunnyCDN, Fourthwall, Microsoft Clarity (g6ywd3275i), GTM, Google Workspace; 16 subdomains; GoDaddy (2017–18) → Cloudflare (2024+).